Skip to content
View Anurag-kumar-Molankala's full-sized avatar
🎯
Focusing
🎯
Focusing

Block or report Anurag-kumar-Molankala

Block user

Prevent this user from interacting with your repositories and sending you notifications. Learn more about blocking users.

You must be logged in to block users.

Please don't include any personal information such as legal names or email addresses. Maximum 100 characters, markdown supported. This note will be visible to only you.
Report abuse

Contact GitHub support about this user’s behavior. Learn more about reporting abuse.

Report abuse

πŸš€ Welcome to My GitHub Profile

MasterHead

πŸ‘‹ Hi, I'm Anurag Kumar

Power BI Developer | Data Analyst | UI/UX Enthusiast

Profile Views


πŸš€ About Me

I am a Power BI Developer & Data Analyst with a passion for transforming raw data into compelling insights through interactive dashboards. My expertise lies in data visualisation, business intelligence, and UI/UX design principles, ensuring that dashboards are not just informative but also visually engaging.

πŸ”Ή My Core Skills:

βœ… Advanced Power BI Development – Crafting detailed and interactive dashboards
βœ… DAX & Power Query (M Language) – Complex calculations & data transformation
βœ… Data Modeling & KPI Metrics – Structuring data for performance optimization
βœ… UI/UX Design for Dashboards – Creating user-friendly & aesthetic visuals
βœ… SQL & ETL Processes – Managing large datasets efficiently
βœ… Frontend Web Technologies – Enhancing dashboards with HTML, CSS, Bootstrap, JavaScript, and jQuery

I specialise in building sales analytics, financial reports, HR insights, and operational dashboards that drive business decisions.


πŸ“Š Power BI Portfolio

Here are some of my top projects, where I combine data analytics with visual storytelling:

πŸ”Ή HR Analytics Dashboard

πŸ“Œ Analysing workforce trends, attrition rates, and job satisfaction using Power BI.
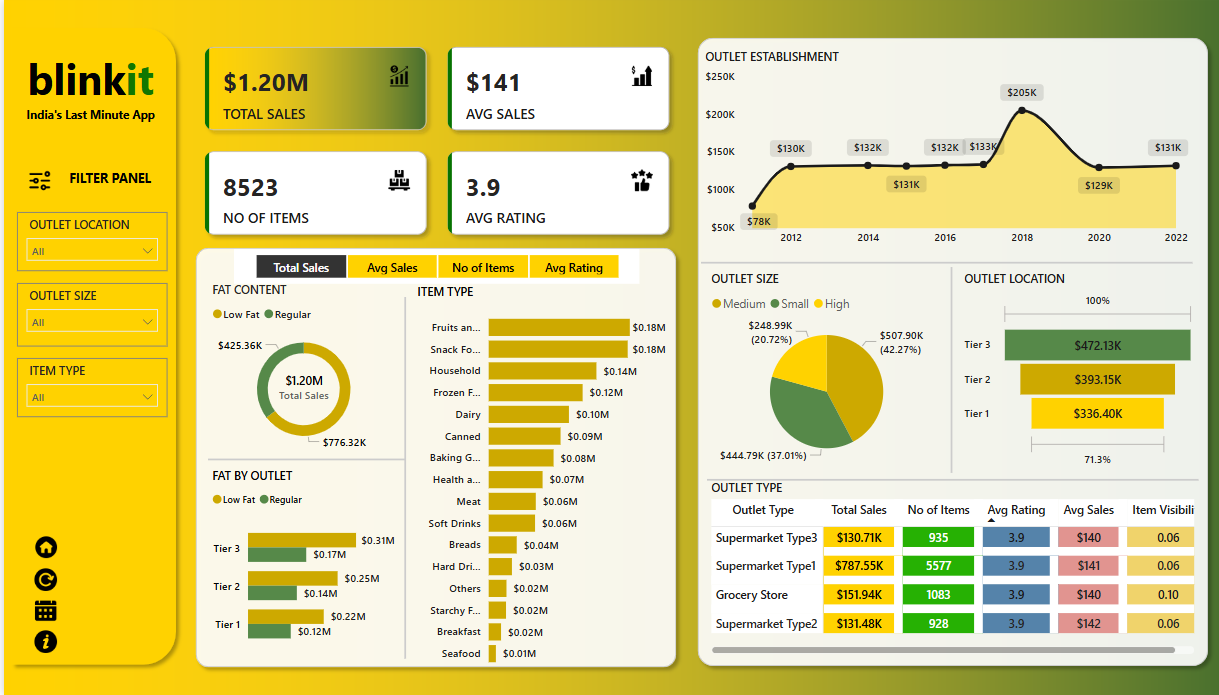
HR Dashboard

πŸ”Ή Blinkit Grocery Sales Dashboard

πŸ“ˆ Revenue tracking, profit margins, and regional sales insights.
Sales Dashboard

πŸ”Ή Financial Analysis Dashboard

πŸ“Œ Tracking key financial KPIs, cash flow, and expense trends.
Financial Performance Dashboard


πŸ›  Tech Stack

Business Intelligence & Data Analytics:

  • Power BI
  • SQL
  • DAX | Power Query (M) | Data Modeling | KPI Metrics

UI/UX & Frontend Technologies:

  • Figma
  • HTML5
  • CSS3
  • Bootstrap
  • JavaScript
  • jQuery

🎯 How I Make Power BI Dashboards More Engaging

πŸ”Ή UI/UX Best Practices – Clean layouts, color psychology, intuitive navigation
πŸ”Ή Custom Visualizations – Enhancing default Power BI visuals for impact
πŸ”Ή Dynamic Interactivity – Drill-through, slicers, and interactive filtering
πŸ”Ή Performance Optimization – Fast-loading dashboards for large datasets


πŸ’¬ Ask Me About

βœ… Power BI Development – DAX, Data Modeling, Performance Optimization
βœ… Business Intelligence & Data Analytics
βœ… ETL (Extract, Transform, Load) using Power Query
βœ… KPI Dashboards & Data Visualization Best Practices


πŸ“¬ Let's Connect

LinkedIn

Gmail


πŸš€ Conclusion

This GitHub profile showcases my expertise in Power BI, data analytics, and dashboard UI/UX design. My projects reflect a strong focus on data-driven insights and engaging visuals. If you're looking for a high-performance Power BI developer who understands both data and design, feel free to connect with me! πŸš€

Popular repositories Loading

  1. Anurag-kumar-Molankala Anurag-kumar-Molankala Public

    πŸ‘‹ About Me I'm a Power BI Developer with a passion for data visualization and UI/UX design. I create interactive dashboards that turn data into clear, actionable insights for smarter decision-making.

    1

  2. Sales-Performance-Dashboard Sales-Performance-Dashboard Public

    A Power BI dashboard that analyzes sales trends, product performance, customer segmentation, and payment distribution. It uses DAX, time intelligence, and interactive visuals for data-driven insigh…

    1

  3. Data-Professional-Survey Data-Professional-Survey Public

    This Power BI dashboard analyzes survey responses from data professionals, covering key aspects such as salary distribution, job satisfaction, and preferred programming languages. The insights help…

    1

  4. BlinkIT-Grocery-Sales-Dashboard BlinkIT-Grocery-Sales-Dashboard Public

    The BlinkIT Grocery Sales Dashboard is an interactive Power BI dashboard that provides insights into grocery sales performance. It includes key KPIs, sales trends, and outlet performance analysis.

    1

  5. Awesome-Chocolates-Sales-Report Awesome-Chocolates-Sales-Report Public

    The Awesome Chocolates Sales Report is a Power BI dashboard designed to provide key insights into sales performance, shipment trends, and geographical distribution. This interactive report helps st…

    1

  6. Adventure-Works-Data-Analytics-Project Adventure-Works-Data-Analytics-Project Public

    This repository contains a comprehensive Power BI dashboard that provides business insights into sales, customer behavior, and financial performance for Adventure Works. The dashboard follows a str…

    1