This section covers the analysis of EV charging data provided by Schneider Electric from 2017 to 2020. Feature Engineering selection was applied such as correlation tests and PCA was performed. Then, the cleaned data was analyzed from different aspects to derive the problems within the grid and to provide a suitable solution. To simplify the data analysis, the power consumption of the vehicle at a charging station is evenly distributed over the total time that the vehicle takes to charge.

The analysis done on the variation of power consumption in kilo-Watthour(kWh) against Time for all stations under analysis from 2017 to 2020. There were eleven stations involved in the analysis and further details are shown in Section III. The power consumption from 2017 has been increasing until 2019 and it saw a steady decline in the year 2020. The peak power consumption of the year 2019 and 2020 are 3090.991 kWh and 1128.401 kWh, respectively.

-
From 2017, there was a steady growth in the number of electric vehicles this resulted in more power consumption in 2019.
-
2020 power consumption was drastically low because of the travel regulation imposed due to Corona pandemic.
-
The power consumption peaks range between 8 am and 4 pm, this might be because of working hours.
-
The power consumption is minimal for the time range, from 12 am to 7 am and from 4 pm to 11 pm reason might be, because of a smaller number of vehicles being charged in those time range.
TThe following graph is plotted on the variation of total power consumption (sum of power consumption of all the charging stations under analysis) in kilo-Watthour(kWh) against Time for each day from 2017 to 2020.

-
The power consumption is generally found to be high during the weekdays and significantly low during the weekends. Further, Monday and Friday have relatively higher power consumption among the rest of the weekdays. The peak power consumption(total) for Monday and Friday are 1128.88 kWh and 1011.32 kWh, respectively.
-
The power consumption in the working days is significantly higher than the weekends, this might be due to lack of usage of EVs on the weekends.
-
The power consumption on Mondays is found to be greater than that of any other day as there might be higher travelling on the weekends.
-
Similarly, the Friday power consumption might correspond to the higher travelling requirement on the weekends.
-
The rest of the working days (i.e., Tuesday till Thursday) the power consumption is similar and comparatively lesser than that of Monday and Friday, as these days do not succeed or precede by any other day with higher travelling requirements.
The following graph is plotted on the variation of power consumption in kilo-Watthour(kWh) against Time for each station under analysis in 2020. The stations under analysis were named as follows:
			* DE*I2G*ESO0003*001: DE3001

			* DE*I2G*ESO0005*002: DE5002

			* BESUCHER E5.12: E12

			* BESUCHER E3.3: E3

			* DE*I2G*ESO0003*002: DE3002

			* DE*I2G*E00009*8F*1: DEF1

			* BESUCHER E5.13: E13

			* BESUCHER E3.4: E4

			* DE*I2G*ESO0005*001: DE5001

			* BESUCHER E5.11: E11

			* BESUCHER E5.14: E14

-
The stations E11, E12 and E13 are having higher power consumption than the rest of the charging stations. The stations under analysis may be divided into two different categories based on their location since the stations have two different naming structures. i.e., E11, E12, E13, E14, E3 & E4( E series ) and DE3001, DE3002, DE5001 & DE5002 ( DE series ).
-
The E series might be closer to the working place than DE series.
-
The E series power consumption can be seen only during working hours whereas DE series power consumption is independent of working hours.
-
The DE series might be a Level- 2 charging station whereas E series might be Level- 3 charging stations.
-
The E series might be more physically visible for the customer compared to the DE series.
The graph depicts the station usage by the customer in the year 2020 from January to September in ascending order of their power consumption.

-
The usage of the stations (E11, E12 and E13) is relatively higher as the parking convenience is better than the rest of the station with lower power consumption.
-
The variation in the usage of the station can be due to variation in the maintenance of the stations and well-maintained station tend to have more customers.
-
The location of most popular stations (E11, E12 and E13) can be under a roof which is an attraction to the new car owners.
-
The most used stations might have sufficient parking space and convenient orientation for parking.
The following graph depicts the number of (BMW i3s, Mitsubishi i-MiEV) cars under each duration level, where duration level refers to the time range between each hour required for the car to charge.The number of cars under analysis are:
				* BMW i3s: 40

				* Mitsubishi i-MiEV: 20

-
The i3s model had larger power consumption due to the larger battery capacity(33kWh) when compared to the i-MiEV model(14kWh).
-
Most of the i-MiEV model charging duration level ranged between 2 and 5 hours, Whereas the majority of i3s model charging duration level ranged between 5 and 22 hours.
-
The power consumption in the charging stations is found to be high, from 8 am to 4 pm which is considered to be the working hours. The significantly high load in working hours affect the overall electricity cost and causes a burden to the grid(overloading).
-
During the working days, the power consumption is higher compared to that of the weekends.
-
The charging stations are not used simultaneously, and each station has different power consumption.
-
Few of the stations has minimal power consumptions or some time no power consumption during the non-working hours.
-
Few stations are more popular than most of the stations and are being used regularly.
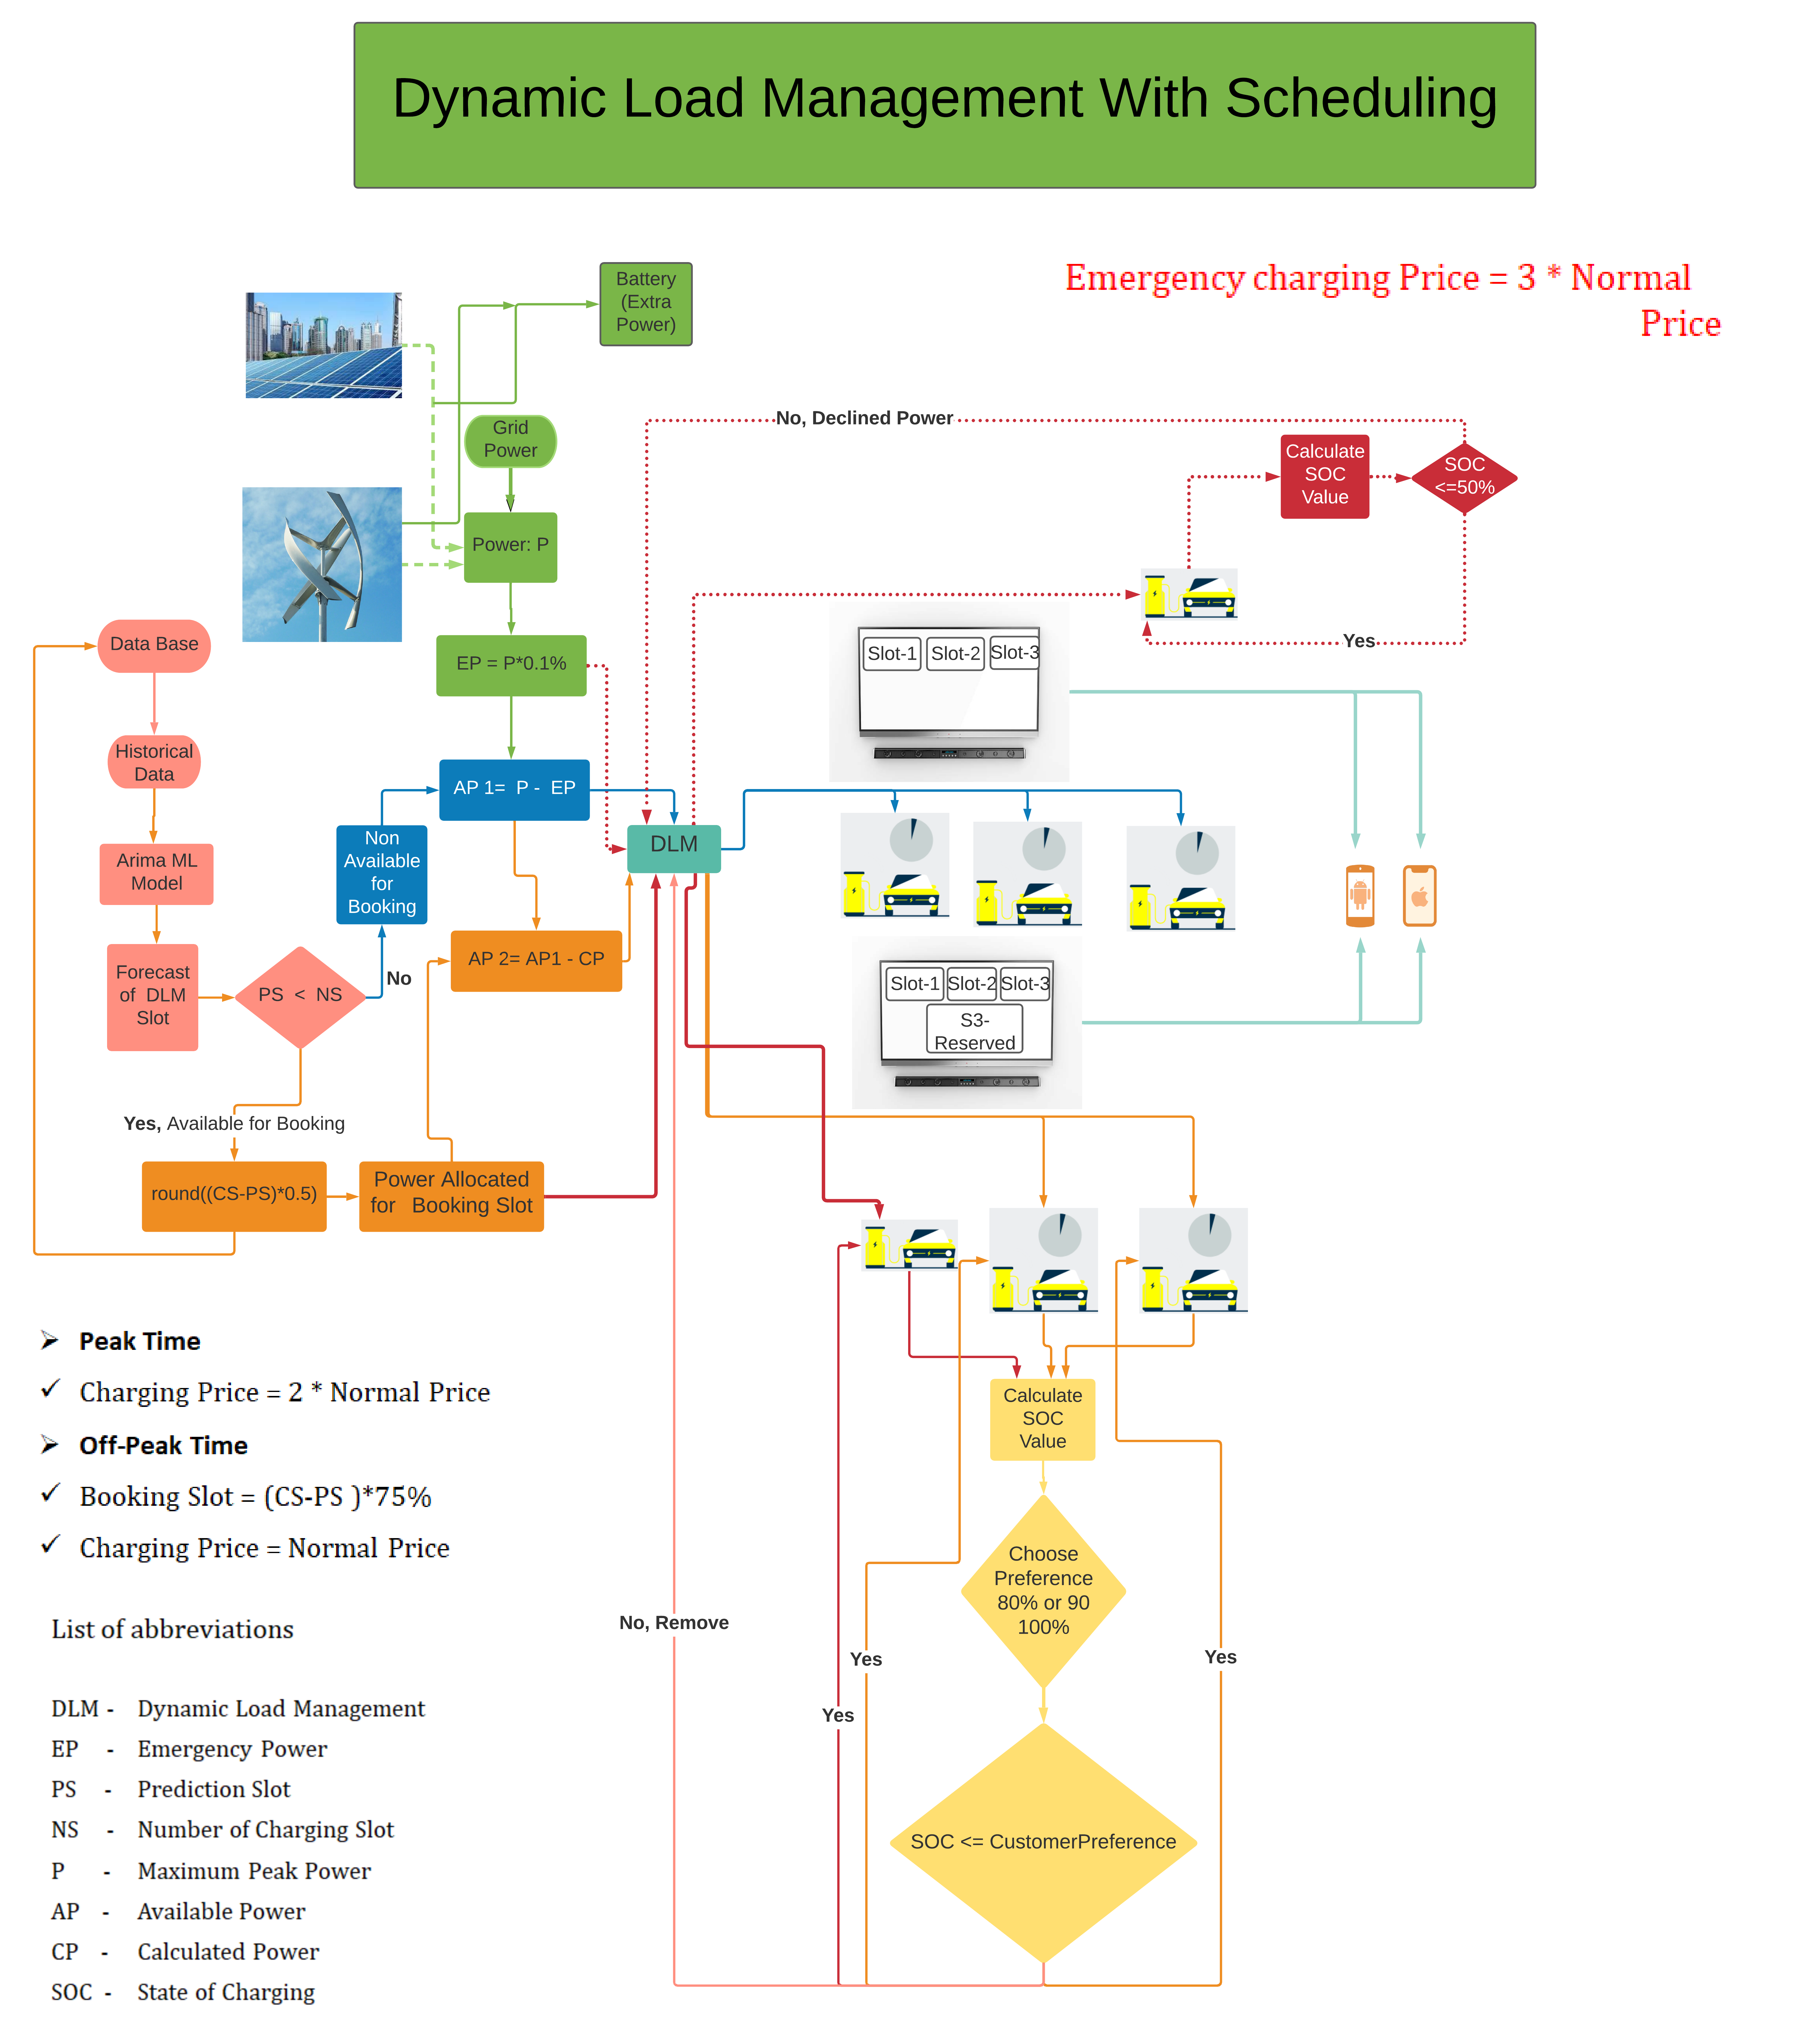
To overcome the above-mentioned problems the Dynamic Load Managment(DLM) with Scheduling strategy can be used.
-
Dynamic load management(DLM) is an energy management system which distributes the electricity to all the EVs that are charged simultaneously and channelise the complete volume of power to the EV whenever the grid has sufficient capacity.
-
This strategy does not involve any infrastructural requirements.
-
The range for maximum load consumption of the grid can be set, which in turn distribute the load to stations accordingly.
-
Simultaneous charging of EVs can be achieved.
-
During Simultaneous charging, the load consumption of each station would be uniform.
-
The ability to customise the maximum load consumption yields in better grid life and reduce the cost of charging during peak hours.
-
The installation of this strategy can be done for a site which is fully allocated to EVs or can be done for a site where another facility shares the maximum allocated power.
-
On addition/removal of stations into the grid, this strategy can be scaled accordingly.